on
Post
- Get link
- X
- Other Apps
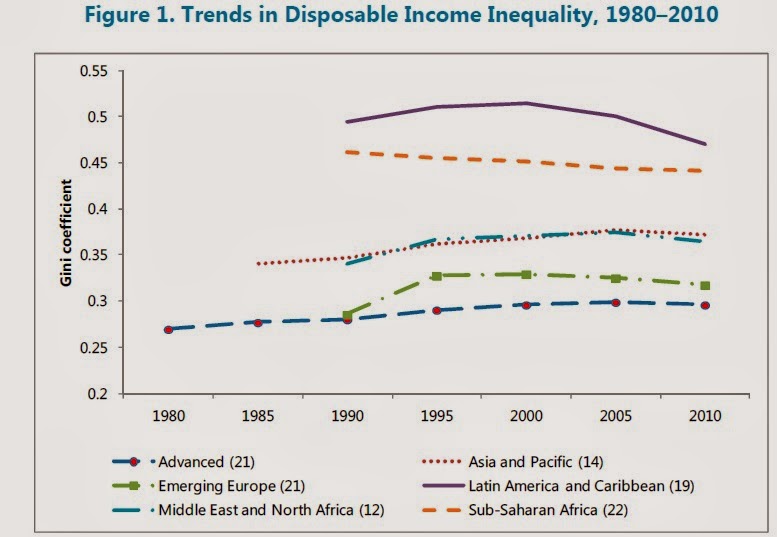
"Between 1990 and 2010, the Gini for disposable income has increased in nearly all advanced and emerging European economies. Over one-third of advanced economies and half of emerging Europe experienced increases in their Ginis exceeding 3 percentage points, with most of the increases in emerging Europe occurring between 1990 and 1995 during the early years of their transition to market-based systems. Inequality also rose in most economies in Asia and the Pacific and in Middle East and North Africa. While average inequality fell in sub-Saharan Africa over this period, it still rose by more than 3 percentage points in more than one-fourth of these economies. Inequality also increased in over one-third of the economies in Latin America, although on average there was a slight decline. However, since 2000 there has been a substantial decline in the Gini in nearly all countries in this region. ... "More striking than changes in inequality within regions are the persistent differences across regions. For instance, between 1990 and 2010, average inequality in each region changed by less than 3¼ percentage points. In contrast, average inequality in the two most unequal regionsThe long-term patterns of inequality at the very top of the income distribution vary as well. For one group of countries--including the US, Canada, the UK, China, and India--the share of gross income going to the top 1% fell through much of the 1950s and 1960s, but has now risen back to levels similar to the 1920s and 1930s. However, in another group of countries--France, Germany, Japan, Sweden--the share of gross income going to the top 1% declined, but then has pretty much flattened out.
(sub-Saharan Africa and Latin America) remained 12 percentage points higher than the two most equal regions (emerging Europe and advanced economies)."


"These surveys, which include the World Value Surveys (WVS), Regional Barometers, and International Social Surveys, ask citizens whether they favor more or less redistribution. In the WVS, respondents are asked to indicate, on a scale from 1 to 10, whether “incomes should be made more equal” (1) or whether the country “needs larger income differences as incentive” (10). For our purposes, we divide these responses in two categories: answers 1 to 5 indicate that the respondents prefer more redistribution, and answers 6 to 10 indicate preference for less redistribution. A similar approach is applied to other surveys to find the share of the population that supports more redistribution. The evidence indicates that public support for redistributive policies has grown in recent decades. Between the late-1990s and the late-2000s, public support for redistribution increased in almost 70 percent of the advanced and developing economies surveyed. For instance, support increased substantially in Finland, Germany, and Sweden, and also in China and India ... Support for redistribution grew more in countries where inequality increased and, more recently, in advanced economies where the crisis hit hardest. For instance, public support between the late-1990s and the late-2000s grew by more than 30 percentage points in China, Finland, Germany and several Eastern European countries, where the income Gini increased by over 20 percent. At the same time, support declined in countries where the Gini decreased, including in Bulgaria, Mexico, Peru, and Ukraine."The IMF calculates how much redistribution is actually happening through tax and spending policies: that is, how much is the Gini coefficient reduced by the tax and transfer policies enacted by government. Here's a measure for the advanced economies, where the Gini based on market incomes would average .43, but the Gini based on disposable after-tax after-transfer income is .29.

Comments
Post a Comment